Toolbar and settings
Labels below match napari-vipp 0.15.0a1. Some labels shorten to icons and graph-local controls move into the gear menu when the window is narrow.
When the VIPP dock is detached from napari, its floating window can be resized freely in width and height or maximized. Reattaching it restores napari's original dock constraints; those embedded constraints should not remain on the floating window.
Workflow tabs
The movable tab bar holds independent live workflow sessions. Each tab retains its graph, calculated results, ancillary caches, undo/redo history, inspector state, file path, dirty baseline, display choices, compute request, and Batch workspace. New and Open create sessions rather than discarding another open graph. Tabs can be renamed, reordered, and closed with Save/Discard/Cancel handling.
Switching tabs restores retained state and does not recalculate scientific results. The selected tab is acknowledged immediately and can show an indeterminate restoration state while its retained graph, inspector, thumbnails, and caches are reattached; this is not a processing run. A collection batch remains owned by its originating tab; VIPP blocks closing that origin, launching a second batch, or closing the application until the active run finishes or cooperatively cancels.
Workflow toolbar
The command bar groups New / Open / Save, Batch / Preview, calculation and compute, then Undo/Redo and the gear menu. Below the workflow tabs, the graph context row holds sidebar toggles, Find in workflow, Refresh, Focus, Auto Arrange, Tunnels…, and zoom. This keeps graph navigation separate from file and execution actions.
| Control | Effect |
|---|---|
| New | Create a new workflow tab. Open one of 19 bundled examples through Gear menu → Open example…. |
| Open | Open an external or saved workflow JSON. A valid attached batch configuration restores Batch workflow and checks sources without calculating a representative. |
| Save / Ctrl+S | Save the active tab's graph, parameters, layout, compute request, bypass choices, and presentation profiles—not calculated arrays. The first save asks for a path; later saves follow the configured save policy. Save workflow as… or Ctrl+Shift+S chooses another path. An active batch can be attached to the workflow JSON. |
| Batch | Open or return to Setup, Items & outputs, Overrides, and Run & results in the retained Batch workflow window. |
| Leave batch | Discard the representative's transient collection-source overrides and return the tab to ordinary single-image mode. It does not delete files and is unavailable during a run. |
| Preview | Change graph-card presentation: thumbnail mode, contrast, range, colormap, detail, and port labels. It does not run a batch representative. |
| Export Python… (gear menu) | Generate a headless script using the shared workflow executor. |
| Export OME dataset… (gear menu) | Save one reference image with associated graph label outputs. |
| Tunnels... | Manage named graph outputs and subscribers. |
| Auto Arrange | Apply a one-shot source-to-sink layout; undo restores positions. |
| Focus | Recover the graph center without changing zoom, selection, layout, cache state, or undo history. |
| Refresh | Re-evaluate ordinary automatic graph state. |
| Calculate all | Calculate manual nodes that are not current. During isolated tuning, first apply the tuned result and release the temporary downstream boundary. |
| Undo / Redo | Reverse or restore supported workflow edits. Parameter changes restore in place and invalidate only the changed node and descendants; one completed slider gesture contributes one history step. |
Image Source cards display the live layer, sample, file, or collection binding in an elided subtitle and retain the complete value in a tooltip. A compatible node dropped onto an existing wire can split that connection in place. Named output tunnels can be rerouted by dragging their source badge to another compatible output; preview/commit share type, cycle, and topology validation, and the accepted edit is atomic and undoable.
Drop a supported image file directly onto an Image Source card to open it.
With that card selected, Ctrl+V / Cmd+V accepts a copied file or image
pixels. File-backed inputs retain their reader metadata; raw clipboard pixels
become a normal napari layer with explicit RGB/RGBA semantics. Pasting pixels
does not invent physical calibration or an original microscope file.
When previewing a batch item, the strip above the graph shows the sample, position, and source information without repeating an equivalent batch ID. Its inspect-item action returns directly to that sample in the Batch workflow window. See process a folder.
Compatible fixed-single-output processing cards expose Bypass node in the inspector and context menu. Bypass forwards the exact primary input without running the operation. Sources, writers, unused terminals, tunnels, dynamic or multiple outputs, and unsafe type splices remain unavailable. A bypassed card keeps its badge, faded dotted outline, pass-through cue, and optional presentation-only would-run thumbnail; clear the action to run it again.
For a local multiscale OME-Zarr image or label, the Image Source inspector's
Resolution panel provides a dynamic Show in napari chooser. It lists
Analysis output — L0, Presentation preview — Auto (best fit), and one
Presentation preview — LN entry for each lower level declared by the
source. A lower-level napari layer is labelled
Preview level N - analysis remains full resolution. A completed background
preview does not replace or take focus from the active analysis or VIPP Inspect
layer; choose it explicitly to show it. Try loading preview again appears
only after a preview failure. Presentation selection never changes the level-0
graph input.
If a complete local OME-Zarr source is unsafe for host RAM but an exact direct read can be proven, the same inspector offers Add fitted Crop Stack or Fit existing Crop Stack. The centred content-agnostic proposal is one explicit undoable edit and must be reviewed; VIPP never adds or changes the Crop without the user's action.
Crop Stack exposes Z start/end only for an explicitly identified Z axis and keeps time/channel dimensions intact. Dragging margins updates a lightweight 2D current-plane guide or transparent 3D wireframe, then commits one scientific edit on release. ROI outline thickness is clearly separated from crop margins because it changes only the 2D/3D guide, not pixels, workflow hashes, batch output, or export.
Compute controls
| Control | Effect |
|---|---|
| Auto / CPU / Prefer GPU / Custom | Auto is the learning default and appears first. CPU forces authoritative host implementations. Prefer GPU uses every reviewed eligible public GPU candidate without requiring a CPU-speed win. Custom exposes authored per-node CPU/GPU choices and benchmarking. |
| Actual-run compute summary | After an accepted run, summarizes the CPU/GPU mix or fallback state; hover for why the run made those decisions. |
| Find fastest pipeline… | In Custom mode, benchmark scientifically eligible implementations for unlocked nodes, validate a proposed whole-pipeline assignment, and present grouped per-node/per-implementation evidence for review. A scientifically successful but speed-inconclusive result remains inspectable and changes nothing. |
| Fail if a selected GPU cannot run | Return an error when an explicitly selected GPU implementation is unavailable or ineligible for the exact call/memory plan instead of using a fallback-safe visible CPU decision. A non-fallback-safe rejection fails under either policy. |
| Compute setup and memory… | Verify the optional GPU stack, show typed eligibility/repair guidance, and inspect host RAM plus discrete VRAM or unified memory where supported. |
New sessions default to Auto. A schema-3 workflow loads as CPU because the old file did not author compute intent. With no exact compatible history, Auto uses reviewed GPU defaults. Accelerated-only history makes the next global Auto run measure CPU once on the same execution surface. Once both observations exist, a later matching run uses acceleration only if it clears the reviewed 1.20x/20-ms gate; otherwise it uses CPU. Only successful, fallback-free completed full-pipeline wall times are retained. Interactive, batch, and registry-lifecycle timing surfaces are never mixed, and Auto never silently benchmarks multiple implementations. Use Prefer GPU for global accelerator placement without a speed requirement or a reviewed Custom provider/Find fastest pipeline… proposal for per-node control.
Prefer GPU bypasses only Auto's CPU-versus-GPU performance gate. Scientific, dtype, parameter, dependency, environment, and memory admission remain active, and unsupported nodes receive an explained ordinary CPU decision. Prefer GPU requires visible fallback. If every eligible GPU has complete comparable timing evidence, VIPP chooses the fastest GPU; otherwise stable implementation-ID order provides a deterministic choice without making a speed claim. Per-node preferences and both benchmark actions are inactive until Custom is restored.
Entering Custom while idle preserves the last valid output and its actual provenance. If it does not satisfy saved Custom choices, its muted badges and summary say that it is a previous result rather than relabeling it. Compute mode, fallback, per-node preference, and optimizer-lock controls are disabled during calculation or benchmarking. They unlock after normal completion; to change policy sooner, use the explicit cancellation action and wait for resource cleanup.
In Custom mode, an operation with a declared provider shows Auto for this node, CPU, and one GPU · library entry for each declared library. Auto for this node authors no backend pin and uses the reviewed Auto default for that node. It does not consume raw benchmark records or Auto's completed-run history, which is consulted only when the global mode is Auto. The choice remains visible even when the current call or environment will later be rejected, fall back, or fail; execution admission is call-specific. Best GPU appears only when several libraries genuinely compete. Exact implementation pins are an advanced persistence/API feature; a loaded pin remains visible until deliberately replaced. A separate optimizer lock—not merely choosing a backend—preserves a node during Find fastest pipeline….
Calculated cards show compact CPU, GPU · CuPy, or amber CPU fallback badges. A muted badge belongs to the last accepted run while a new result is pending or current Custom intent differs. Hover or inspect the node for the implementation ID and version, runtime/device, preference, decision reason, benchmark evidence, memory estimate, and fallback details.
Node benchmarking and whole-pipeline optimization use the exact current inputs and require scientific parity before timing alternatives. CPU timing uses paired warm medians; GPU timing distinguishes resident compute from transfers modeled across the complete pipeline. The optimizer reports overall and current-operation progress plus Elapsed and Current stage timers. The stage timer resets when the node, backend, or measurement phase changes, not with every progress update. Elapsed time continues while waiting for safe cancellation and stops when the attempt finishes; a retry starts a new timer. A ticking clock shows that the interface is responsive, not proof of progress inside an atomic CPU call. Some CPU calls report only when they finish. A monolithic library call can remain at one percentage until it returns; a reached time limit means comparisons remain, not that the current graph was proved optimal. The time limit takes effect at safe checkpoints and cannot forcibly interrupt every active library call. Completed exact benchmark records are reused on retry.
When dtype is the only remaining blocker for a reviewed GPU region, an affected node may show a subtle GPU tip. Its inspector explains the exact conversion and memory trade-off. Add conversion inserts a visible Convert Dtype node on that input as one undoable graph edit; calculation never performs the cast silently. Prefer GPU continues to show the applicable tip after calculation.
For the practical sequence, first-release GPU-region summary, dtype caveats, and platform/install boundary, see choose and verify CPU or GPU compute.
Feedback surfaces
VIPP uses one severity-aware message strip for workflow, graph, source, compute, and batch feedback. Routine information and warnings remain lightweight; only an actionable error uses a filled, full-width alert. A message is not the execution record: the toolbar actual-run summary and per-node badges carry the compact compute result, while the detailed execution/provenance view explains implementation and fallback decisions.
Napari's status bar at the bottom of the viewer is separate. It belongs to the viewer and reports coordinates, values, and layer interaction; VIPP does not duplicate that purpose in its message strip.
Display settings
Open Preview in 0.15.0a1 for graph thumbnails, contrast, colour, resolution, and port names. These settings never alter scientific arrays.
See Graph display settings for the options, exact-statistics behavior, and the clearer Display settings labels in post-0.15.0a1 nightly builds.
Execution and memory settings
| Setting | Meaning |
|---|---|
| Run all in BG | Checked: dispatch every graph recompute to background processing. Unchecked: use adaptive execution, keeping small ordinary work immediate while backgrounding known expensive operations and large inputs. |
| Cache mode | Keep all outputs, use Smart interactive cache, or use Low-memory mode. |
| Auto memory guard | Switches away from keep-all and prunes optional outputs if the configured cache share is exceeded. |
| Cache limit | Share of free-or-reclaimable memory used by the keep-all cache before the guard acts. |
| Keep output cached | Per-node request to retain an important result in Smart/Low-memory modes. |
| Auto Recalculate | Re-runs a selected manual node when upstream state changes; use cautiously for expensive work. |
Host cache status reports RAM; on Windows it separately shows remaining system commit because either physical or commit headroom can limit an allocation. Compute setup and memory… adds accelerator memory: discrete NVIDIA devices report separate VRAM, while a future unified- memory provider must report the shared budget rather than double-counting it. The executor applies an operation-specific conservative memory estimate before device work; the estimate and any typed OOM/fallback are part of execution provenance.
Cancel calculation prevents queued reruns and rejects the active result. It asks cooperative work to stop, but cannot forcibly interrupt every NumPy, SciPy, or scikit-image, CuPy, or CuPyX call already executing. GPU progress advances only after synchronization at a truthful operation checkpoint, and cancellation waits for cleanup before compute controls unlock. Failed/OOM attempts never replace prior processing results with uncomputed or provenance-unknown values. A verified source boundary may be accepted. If cleanup itself failed, a completed processing node may additionally be accepted, but only with matching actual-implementation provenance; all other nodes retain their coherent outputs, thumbnails, and badges.
If cleanup fails after calculation, node benchmarking, Find fastest pipeline…, or a collection batch, VIPP requests cancellation of other active compute and every compute entry point, policy control, and policy-changing undo/redo action is disabled for that process. The actionable message asks for a restart because an ordinary CPU fallback cannot establish that an incompletely cleaned accelerator runtime is safe.
The current adaptive large-input boundary is 4,000,000 elements or 32 MiB, whichever is reached first. This applies even when Run all in BG is unchecked. Exact threshold diagnostics, Auto Contrast, colocalization density, and generated-layer contrast calculations also leave the user-interface thread when their inputs are large.
Stack thumbnail statistics use the same shared toolbar progress and cancellation surface. Progress names the node, backend, and active statistics phase. CPU integer histogram and min-max work stops at bounded chunk boundaries. An active GPU kernel/synchronization or exact float/other-dtype NumPy percentile inner call may be indeterminate and non-interruptible; Cancel takes effect at the next cooperative boundary. VIPP keeps provisional thumbnails and does not publish a partial contrast limit. Completed exact limits remain cached after an ordinary successful run or safe fallback. Accelerator cleanup failure instead enters the same process-wide compute quarantine as scientific GPU cleanup failure.
Background execution changes where work runs, not the method or the values it uses. Exact operations still inspect the complete required population. They may consume CPU time and memory while napari remains responsive.
Generated Image and Labels layers carry VIPP's axis names into napari when the
installed layer API supports them. Labels follow displayed rank, omit a hidden
RGB/RGBA component axis, and update on layer reuse. Hidden or provisional source
previews cannot replace the selected scientific layer's labels. This is viewer
presentation only and never changes ImageState or operation semantics.
Tune one node in isolation
Tune node in isolation is available in the selected-node inspector and the node context menu. The selected node must have a coherent cached result, and no dirty edit, pipeline calculation, source load, or batch run can be pending or in flight. Downstream nodes do not all need to have outputs.
While the session is active, parameter edits recalculate the selected node but pause propagation beyond it. The tuned node is the bright-amber actionable frontier. Its downstream closure is darker amber and labelled as waiting; those cards keep their last coherent results when they have them and otherwise remain unavailable. Neither case may be interpreted as a result of the new parameter values.
- Apply and continue keeps the latest parameters and local result, releases the boundary, and resumes calculation from the node's direct descendants.
- Cancel tuning restores the parameters, output, and execution state that were current when the session began without recalculating the held branch.
- Calculate all applies the current tuning result before performing its ordinary automatic and manual-node scheduling.
Only one node can be isolated at a time. A graph, layout, note, workflow-load, undo/redo, or other history-backed edit first commits the current tuning result, so cancellation cannot cross graph revisions. The isolation boundary and its restoration snapshot are transient session state; they are not written to workflow JSON.
Inspector surfaces
Depending on the selected node/output, the inspector can show parameters, execution state, output metadata/history, output and input histograms, label volume distribution, colocalization scatter, table preview, auto contrast, Pin selected, Save selected output..., and an explicit reset of the selected output's remembered display profile.
Numeric parameter entry
Numeric spinners accept direct keyboard entry as well as their step buttons and
paired sliders. Floating-point fields accept decimal points or commas and
scientific notation such as 2e-4; sufficiently small non-zero values are also
displayed in scientific notation. A slider is an exploration window, not
necessarily the full valid entry range. Right-click a numeric field and choose
Reset to default to restore that operation's declared default.
When an image-dependent bound acts on integer data, the corresponding slider and spinner use whole-number steps and values. Floating-point input restores decimal entry. This prevents controls such as explicit Clamp Intensity bounds from authoring a fractional value that the integer operation cannot represent. Sliders keep a practical tuning window even when the spinner accepts a wider validated range; Sigma Filter radius is one example.
Manual execution colors
Manual/cached execution barriers apply to every VIPP operation that uses the manual policy, including measurements, graph analysis, colocalization, and deconvolution.
| Graph color | Meaning | Action |
|---|---|---|
| Bright amber | This is the first manual node stopping the branch. It has never been calculated, or its cached result is stale. | Select this node and choose Calculate or Recalculate, or use Calculate all. |
| Dark amber | This downstream node is also stale, but it is waiting for the bright-amber upstream barrier. VIPP retains its last coherent cached result when one exists; otherwise it remains unavailable. | Resolve the bright-amber node first; this node will then run or become the next actionable barrier. |
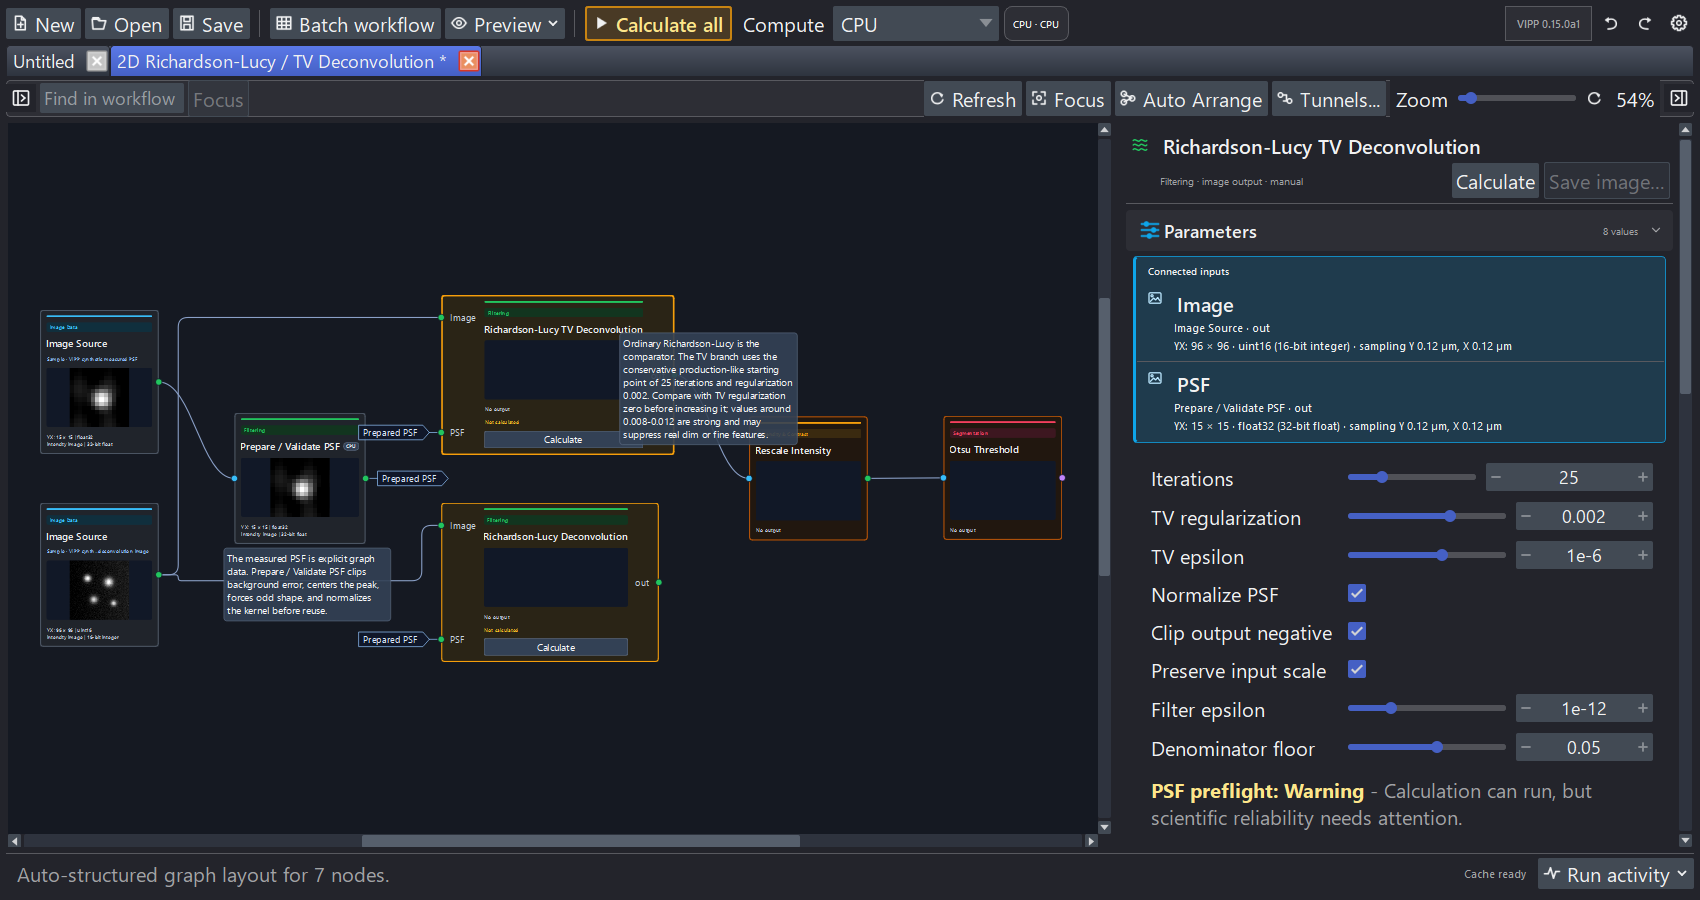
The two deconvolution branches are actionable. Rescale Intensity and Otsu Threshold wait behind the selected RL-TV branch and are not the source of the problem.
The toolbar Calculate all button also turns bright amber while an uncalculated or stale manual frontier needs attention. It returns to the normal toolbar style when no such action remains. A node already configured for Auto Recalculate does not trigger this user-action prompt while VIPP is handling it automatically.
This distinction also applies during background execution. A dark-amber node does not show a processing spinner until it is actually runnable. Once that node finishes updating, it returns to its normal current color immediately while later nodes continue calculating; it does not remain dark amber until the whole branch finishes. Every completed card receives a run-scoped execution state and sampled thumbnail. Selecting, pinning, or inspecting tables and metadata uses the same newly completed run-scoped payload when the active cache policy already retains that node. Low-memory pruning remains in force for other intermediates, which follow the normal cache-restore behavior when selected. VIPP still commits the scientific workflow cache only after accepting the complete background run. Cancelling, superseding, or editing during a run discards these temporary presentation updates and restores the last coherent cache view.
The active VIPP Inspect layer
When the same logical node/output recalculates with a compatible active VIPP
Inspect Image presentation, VIPP reuses the existing layer object and
replaces only its data reference. The new reference exposes the exact
underlying pixels as a non-writeable view. VIPP preserves displayed dimensions
and slice positions, camera zoom/translation/rotation, and compatible styling
such as colormap, contrast, blending, opacity, visibility, gamma,
interpolation, and compatible rendering settings. Layer scale is reapplied
from output metadata; arbitrary napari transforms are not saved in a display
profile. Isolated tuning therefore remains on the same viewed region. Pinned
layers are separate viewer artifacts and do not receive this saved per-output
profile behavior.
VIPP remembers presentation independently by node, output port, and RGB surface and saves those profiles as workflow UI state. Switching to a different logical output restores that output's profile or initializes safe defaults; the previous output's styling cannot leak across the switch. Use the inspector header reset action to return the selected output deliberately to defaults.
VIPP replaces the layer for a genuine presentation-class change, such as
Image to Labels, or for an incompatible RGB layout. A Boolean mask pinned
as a napari Labels overlay requires a uint8 presentation copy. That conversion
is limited to the class-changing display path and is not written back to the
node output: the scientific cache, saved output, and downstream calculations
retain the original exact array.
Auto Contrast Versus Display Contrast
Auto Contrast appears for Linear Scale + Offset. It calculates exact
full-input finite percentiles from the chosen saturation setting and writes the
resulting alpha and beta into the node. It therefore changes workflow data.
The contrast limits on inspect and pinned napari layers are display-only. Large layers can briefly use an explicit provisional dtype range while VIPP obtains the exact full finite range in the background. A manual napari contrast edit made during that calculation is preserved. Neither the provisional nor final layer contrast changes downstream arrays, masks, thresholds, or measurements.
The histogram panel is also a display summary. It counts every finite value, but its chart bins are independent of a floating-point automatic-threshold node's saved Float histogram bins parameter.
Every node in the Intensity & Contrast palette family shows both its input and output histogram when an array result is available. Input and output scope controls remain independent, so changing a histogram from the current slice to the full stack changes only the display summary, not workflow data.
Draggable histogram guides
Input-histogram markers for Binary Threshold, Hysteresis Threshold, explicit Rescale Intensity/Clamp Intensity cutoffs, and supported colocalization thresholds are editable by dragging. A pointer click without movement does not change the parameter.
Rescale Intensity has two draggable guides. Moving a percentile-derived guide switches the node to Explicit values, preserves the other exact cutoff, and queues interactive recalculation. This is a scientific parameter edit: save the workflow after accepting it. VIPP reuses unchanged input counts while a manual marker moves and refreshes the output histogram after the output changes.
Colocalization scatter controls
Use Open in window in a metrics node's scatter section. The inspector and resizable pop-out share a linked colormap; colour and log-density changes reuse the cached density. Density bins can request up to 4,096 bins per axis in the pop-out, subject to a background memory preflight. The compact inspector uses a mass-preserving derivative of at most 1,024 bins per axis.
Zoom to populated data, Populated range percentile, and Equal axis scales change the view, not the full ROI used for exact metrics. The default uses zero-inclusive shared axes. Export size controls square PNG/TIFF size independently of the window dimensions.
Threshold dragging previews guides and a density-derived count; release commits the scientific threshold and requests the exact full-ROI count. Legacy graph scatter-raster nodes remain executable but are hidden from the palette. See inspect outputs.
Image Source and Batch Image stack controls
The Image Source inspector has an Image stack chooser for a file, store,
sample, or napari-layer binding. It defaults to Use the file's labels
unchanged. A reviewed Stack planes are depth slices (Z stack) choice saves
QYX -> ZYX with the workflow; Something else (advanced)... accepts a
complete reviewed source-to-effective declaration. All choices relabel axes by
position without transposing pixels.
Each collection source in Batch workflow has an Image axes chooser:
| Choice | Effect |
|---|---|
| Automatic (recommended) | Default for a new unsaved row. VIPP changes it only when an ordinary TIFF reports exactly QYX and the representative reaches a demonstrated ZYX workflow requirement. |
| Use the file's labels unchanged | Trust the reader labels and reject the automatic Z-stack interpretation for this source. Loaded blank declarations use this conservative choice. |
| Stack planes are depth slices (Z stack) | Save the guarded QYX -> ZYX interpretation. Axis names change in place; pixels are not transposed. |
| Something else (advanced)... | Enter an uncommon reviewed source-to-effective axis declaration. |
When Automatic can resolve the exact case, VIPP visibly selects the Z-stack choice and shows why it changed, that it will be saved, and that pixel order is unchanged. Verify the page meaning and Z calibration independently. Preview and Run use the same check; headless execution never invents a missing declaration. The Image Source and Batch controls share the same declaration parser, validation, metadata application, and headless execution infrastructure.
Batch representative strip
After Preview selected, the persistent strip above the graph provides Previous/Next, a full-plan slider, item position, and source information. Its inspect-item action opens the corresponding sample in the Batch workflow window. Equivalent batch ID/source names are not repeated unnecessarily.
The representative calculates only that item and never saves batch outputs. Its per-sample parameters and whole-batch Run/Bypass profile are applied to a detached effective workflow without editing authored defaults. The inspector shows Effective batch preview where an actual exception affects that node. The requested sample is labelled current only after matching sources load and calculation succeeds.
Leave batch clears transient representative bindings and returns to ordinary single-image use. It is disabled during an active batch run. Batch progress is shown in the retained window's footer and Run & results tab, independently of ordinary graph progress. See process a folder.