Colocalization And Association
VIPP supports pixel, ROI-masked, object-restricted, and label-association workflows.
0.13 colocalization results can differ from 0.12
VIPP 0.13 retains finite native channel intensities rather than jointly scaling/clipping both channels to 0–255. Thresholds and intensity sums now use native units, and the Costes, Pearson, and Manders definitions were revised toward Fiji Coloc 2 3.1.0 semantics. Preserve older results and compare externally before combining versions.
Pixel Colocalization
flowchart LR
  C1["Channel 1"] --> M["Colocalization Metrics"]
  C2["Channel 2"] --> M
  C1 --> V["Colocalized Voxels"]
  C2 --> V
  C1 --> R["RACC Index"]
  C2 --> R
Use Colocalized Voxels for visual threshold review. Use metric tables for
quantitative reporting. These are parallel consumers of the two channels; none
is the input to the next.
Colocalization Scatter Plot produces a durable density-and-guides image in
the graph. Use it in parallel too; it is a presentation/QC output, not a
preprocessing input to the metric calculation.
ROI-Masked Colocalization
flowchart LR
  C1["Channel 1"] --> M["Masked metrics"]
  C2["Channel 2"] --> M
  ROI["ROI mask"] --> M
  C1 --> V["Masked colocalized voxels"]
  C2 --> V
  ROI --> V
  C1 --> R["Masked RACC index"]
  C2 --> R
  ROI --> R
Use masked variants when the analysis population should be restricted to cells, regions, tissue, or user-defined ROIs.
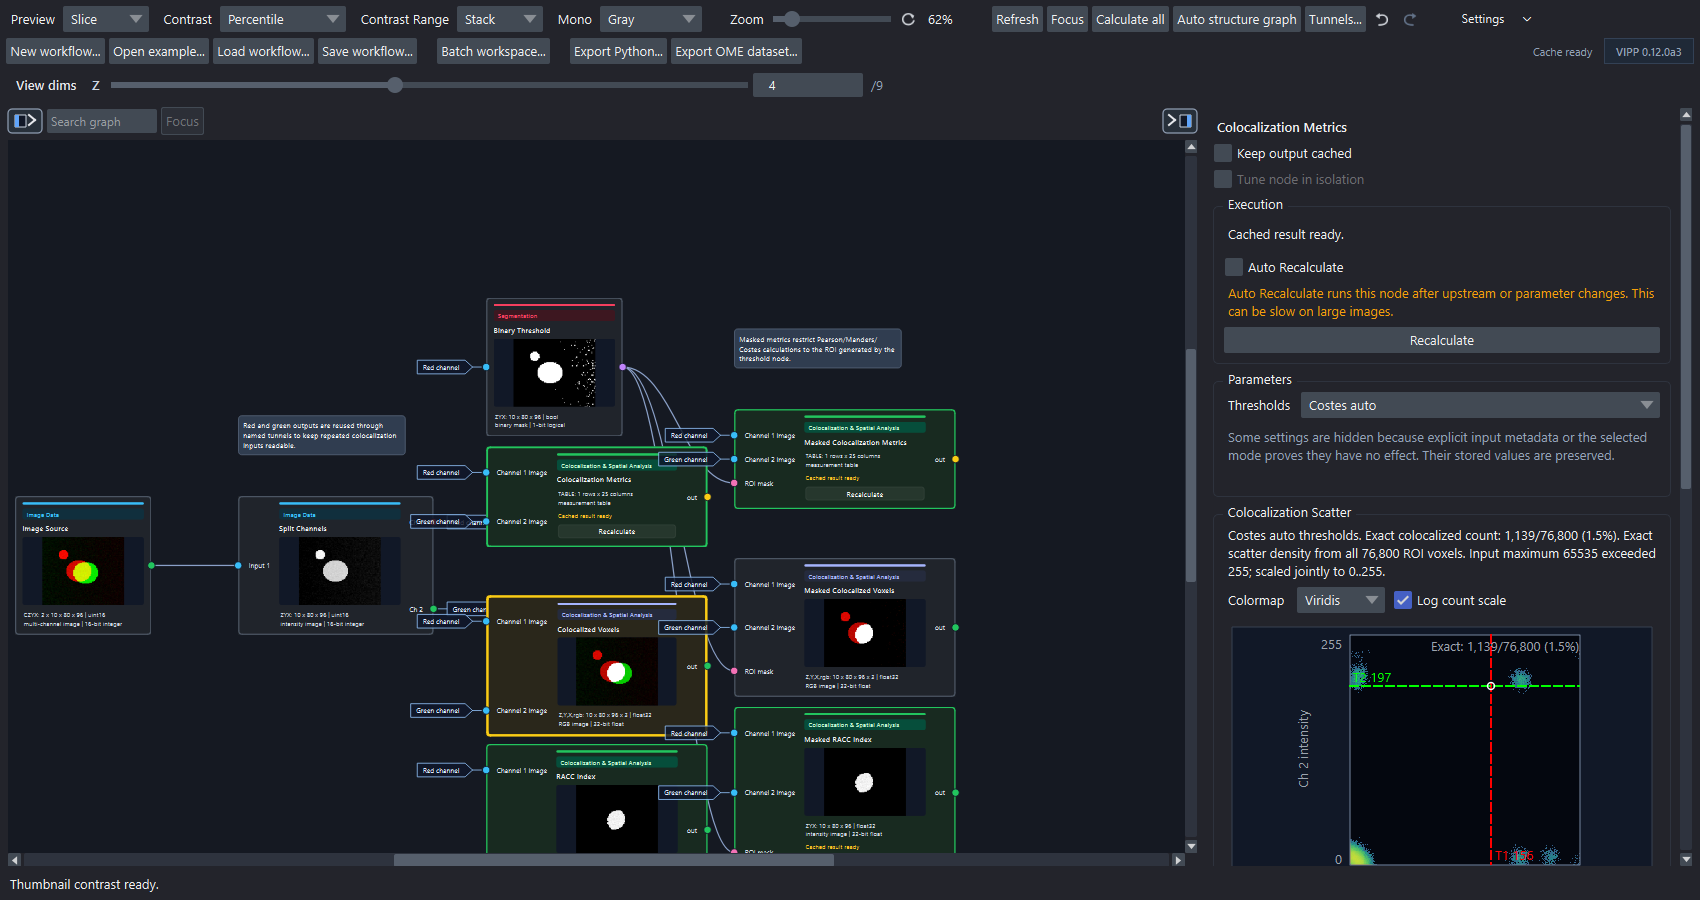
The same red/green channel outputs feed independent metric, voxel, and RACC branches. The selected calculated node exposes its threshold scatter for QC.
What The Scatter Inspector Calculates
The colocalization inspector calculates all three summaries over every voxel in the analysis population:
- the total ROI population (or the complete image when no ROI is connected);
- the number meeting both channel thresholds;
- the complete two-dimensional scatter-density grid.
Large datasets are processed in bounded chunks and off the user-interface
thread. Chunking limits temporary memory; it is not sampling. The density image,
ROI count, and colocalized count all represent the complete ROI population.
Interactive density is capped and reported at 1,024 bins per axis. Dedicated
Colocalization Scatter Plot and Masked Colocalization Scatter Plot nodes
can request independent histogram bins and square output size up to 4,096,
native populated axis ranges, and optional symmetric percentile clipping.
For example, a summary such as Exact colocalized count: 18,420/251,006 means
that all 251,006 ROI voxels contributed to both the count and the displayed
density. The scatter grid is a visual QC summary; the metric table and
Colocalized Voxels output remain the appropriate quantitative artifacts.
Dragging a threshold guide switches the node to manual thresholds. The guides move immediately and compatible threshold-independent density remains visible, while the old exact count becomes a calculating state and the complete ROI is recounted. Rapid requests are coalesced. This is a scientific parameter change, not merely a plot adjustment, so wait for the exact count, recalculate stale manual outputs, and save the workflow afterward.
The inspector and resizable pop-out have linked colormap selectors. Changing the colormap redraws cached density without recalculating metrics. The pop-out can save PNG or TIFF at its current display resolution; use a graph scatter node when the chosen scatter definition and image need to remain in the workflow.
Native intensity and metric names in 0.13
- Pearson no-threshold and threshold-domain outputs now expose canonical names that distinguish an any-channel-below-threshold (OR) population from the both-channels intersection. Shorter older column names remain aliases for compatible table consumers; use the canonical names in new reports.
- Fiji Manders M1/M2 and thresholded tM1/tM2 are reported separately. Existing
manders_m1andmanders_m2columns now alias thresholded tM1/tM2. The older above-threshold intersection fractions remain under descriptive non-Manders names. - Automatic Costes thresholds target Fiji Coloc 2 3.1.0's classic search, including native one-unit steps and its population/tie behavior. This is a source-aligned compatibility implementation, not completed independent parity certification.
Pixel and object tables record coloc_semantics=fiji_coloc2_3.1 and
coloc_validation_status=experimental_source_aligned_golden_parity_pending.
Archive both fields and the exact column names used in analysis. Independent
Fiji-generated golden parity remains pending, so validate this path externally
before consequential use.
Object Colocalization
This produces one row per object and is designed to merge with object morphology and intensity tables.
Label Association
Overlap between two object sets:
Nearest centroid association:
Event or puncta assignment:
Reference Workflows
| Workflow | Purpose |
|---|---|
synthetic-colocalization-racc.json |
Pixel and ROI-masked metrics, scatter threshold review, colocalized voxels, and RACC-like index output. |
synthetic-object-colocalization-association.json |
Object colocalization rows, label overlap, nearest-object distance, event localization, and merged tables. |
Reporting Checklist
Report:
- channels analyzed;
- preprocessing steps;
- threshold mode and final thresholds;
- analysis population: whole image, ROI, or object labels;
- how the ROI was defined and its voxel count;
- whether intensities were normalized or clipped;
- native intensity units and the exact metric column names/semantic status;
- scatter histogram bins, output size, clipping, and axis range when a scatter image is retained as evidence;
- 2D/3D and leading-axis handling;
- ROI or label-generation method;
- RACC parameters if using RACC-like outputs.
Validation Note
The current implementation has frozen method documentation and automated regression tests, but independent Fiji-generated numerical parity remains pending. Broad cross-tool or biological validity claims still require external comparisons, positive/negative controls, and assay-specific validation.